...and time and again
It is a fact that sound engineers use the term phase inflationarily to describe things that usually have something to do with the topic of time but rarely with what just happened to the problem, let alone physically. The reason for this is the widespread use of 2-channel measuring systems that use FFT to show us things in order to do our work faster and more precisely. In addition to the often forgotten hearing, we now usually see two informations, amplitude frequency response and phase frequency response. We derive three parameterizations from this when setting up sound systems, filters for frequency response optimization, level adjustments and time delays. In addition, although further derivatives such as speech intelligibility measurements or contradictory level regulations such as ‘maximum level UNBEDINGT unmanipulable BlaBlaBla dB’ BUT ‘for evacuation UNBEDINGT 3x as much’, these should not play a role here. The focus of this article is on the term and definition of group term. The aim of this article is to clear up misunderstandings and to propose a demarcation from the term phase and delay. At the latest if you have Allpass filters in your toolbox for system setup and use them against simple delays for the phase alignment of top and sub, or worse cardioid or endfired arrays, you should halfway know what group runtime means and optimally we then speak of the same physical phenomenon when using the terms. At this point, I would like to thank my dear colleagues Michael Häck, Markus Zehner and Merlijn van Veen, who not only gave the impetus to think seriously about it, but also discussed it intensively and controversially with me and sometimes also disagree. Here I would like to share my view without claiming that my derivatives are the only valid ones. In the following, I would like to build up a chain of arguments that starts relatively far ahead in order to rule out misunderstandings about the basics and to do without all parameters that are irrelevant for the understanding of the time axis, phase and group runtime. Those who do not want to follow the reasoning because they do not want to deal with self-evident basics, may rush to the conclusion, but make up for this failure before my conclusions are torn in the air.
Harmonic vibration
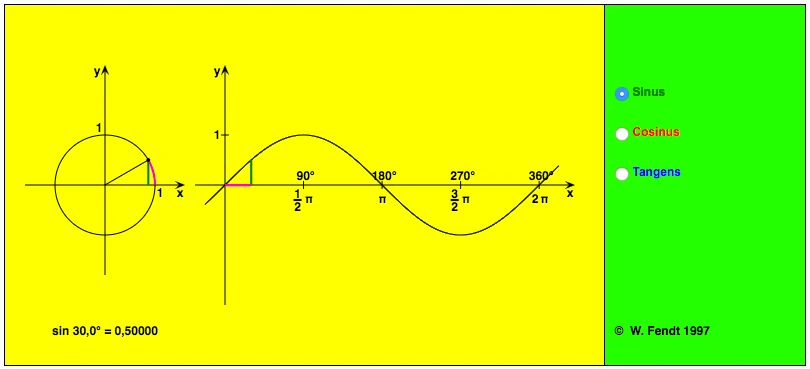
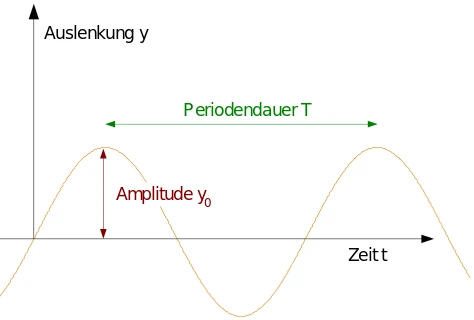
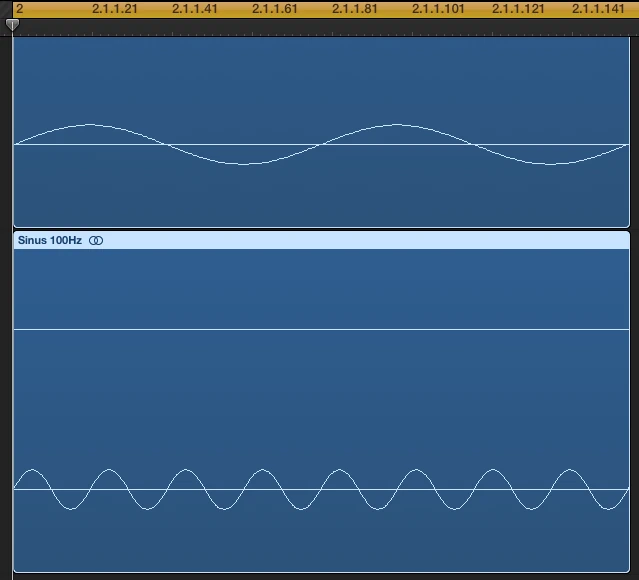
An undamped spring pendulum oscillates in a sine function, the forces acting in both directions are the same. The "pointer" on the "clock" rotates at a constant angular velocity. It results in a periodic oscillation with period duration T based on the angular velocity of the pointer. The frequency is described with its inverse value f=1/T. The position of the pointer corresponds to the amplitude value of the sine oscillation. The absolute time t of an amplitude value corresponds to the relative phase angle Phi of the pointer. Relatively means that the absolute position of the start value of the pointer is a matter of definition, so e.g. the pointer could start at 13:00, just in time for the lunch break and we would define that this is the 0 degree position. ...we do not and agree on the depicted variant based on the sine function which has its origin at Sin = 0° at 15:00 the pointer turns counterclockwise. Consequently, each point in time t in the illustrated time plane on the right has an associated phase angle. The phase angle itself has its origin in the geometry of the circular section on the left, it is only transferred to the time domain.

Overlay of two harmonic oscillations
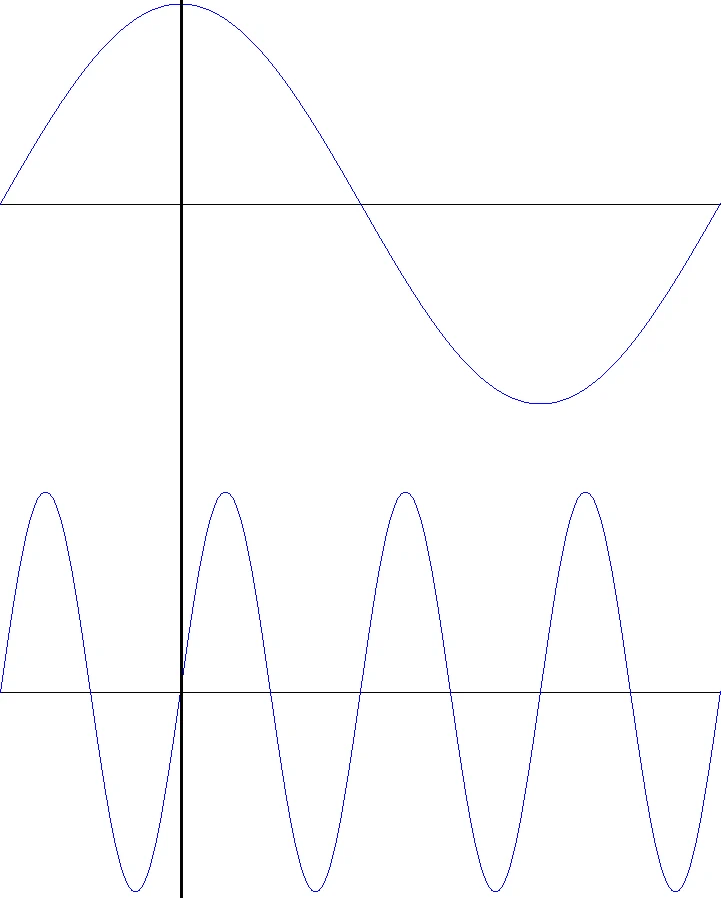
If two periodic oscillations of different frequency overlap, there is a problem of defining the phase angle, because the phase angle describes the time of an amplitude value of a vibration. Is the time shown, for example, 90 degrees or 360 degrees? The answer is: for the lower imaged frequency 90 degrees (top) and for the higher 360 degrees (bottom). This raises the question, what is the difference between 360 degrees and 0 degrees?
The answer is simple, 0 degrees is always the relative starting point of a viewing, the starting point of the vibration, from then on is counted up, for integer periods 360°, 720°, 1440° etc. This in turn shows us the limits of this viewing, who wants to know how much degree 5 minutes is 23 seconds of a 12.7kHz sine? A completely useless piece of information! Of course, the superimposed vibrations in the real world add up and result in a new form of vibration. ...and that's exactly what we're pushing right to the top.
Complex vibrations
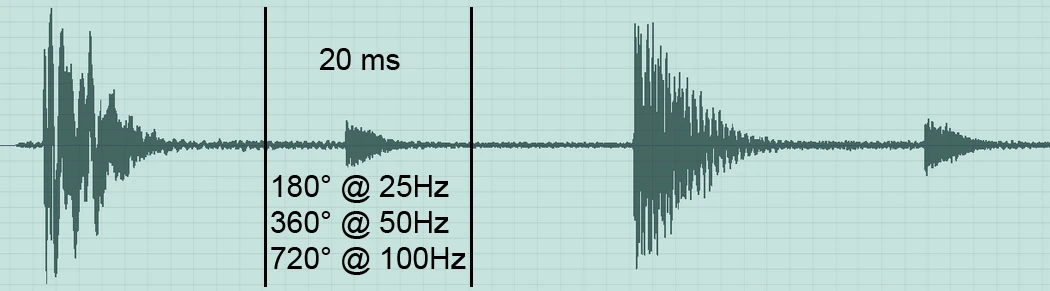
Here we see a typical non-harmonic oscillation as sound engineers would hear if they didn't hit all the dynamic plug-ins so hard, each period passage is individual and uniquely different ... unless the kick drum is sampled ⁇ There are no phase angles here! The only thing you can do is define a period of time, convert it to a frequency and say “this is 360° at frequency X, or X° at 100Hz”.
Now we play this one complex signal into a transmission system consisting of several components, e.g. a sound system with L, R, Sub and consider with the help of measurement technology the impulse responses of the individual paths L, R, Sub and their derivatives phase frequency response and amplitude frequency response. But first let's clarify what an impulse response is.
Impulse response

Let's take any transmission system, in our case power amplifier 1-3, with speaker 1-3 for L, R sub. In the input we feed a Dirac pulse and at the output there is a pulse response which completely describes the transmission behavior. Since a Dirac pulse is a theoretical construction that can only be roughly put into practice and would also cause other problems such as override when measuring loudspeaker systems, one usually uses other stimuli such as pink noise or sine sweeps and simply compares the input signal with the output signal. A piece of superconductor as a “system” does not theoretically cause any difference. Who knows, it's pretty cold. In addition, we know anyway that our system has a difference. A loudspeaker is basically deficient. Our misjudgment is that this deficiency in the work area is constant and can be corrected. As a result, we put an inverted error in front of him, which we ironically call controller. The problem remains the same, the transmission system is not linear, but we are able to linearize individual levels to the detriment of others, e.g. the amplitude frequency response can be optimized by means of filters, to the detriment of the phase frequency response or vice versa. With FIR filters, on the other hand, we can optimize both to the detriment of the system runtime (i.e. latency) and the impulse response (i.e. pre-swing) in addition to the already existing reswing of the IR filters. Assuming we have a faulty system speaker that can be perfectly corrected by a counter-error controller, a system runtime would still be a fault, (work = power x time ...sorry I'm an electrician ...physicists say power x way) Basically it doesn't matter but we should and make aware that we transfer energy and not just generate a voltage. The acoustic energy is the cause of the electrical energy the effect, this in turn the cause of acoustic energy ... only louder and hornier:) But STOP! Let's get back to the phase.
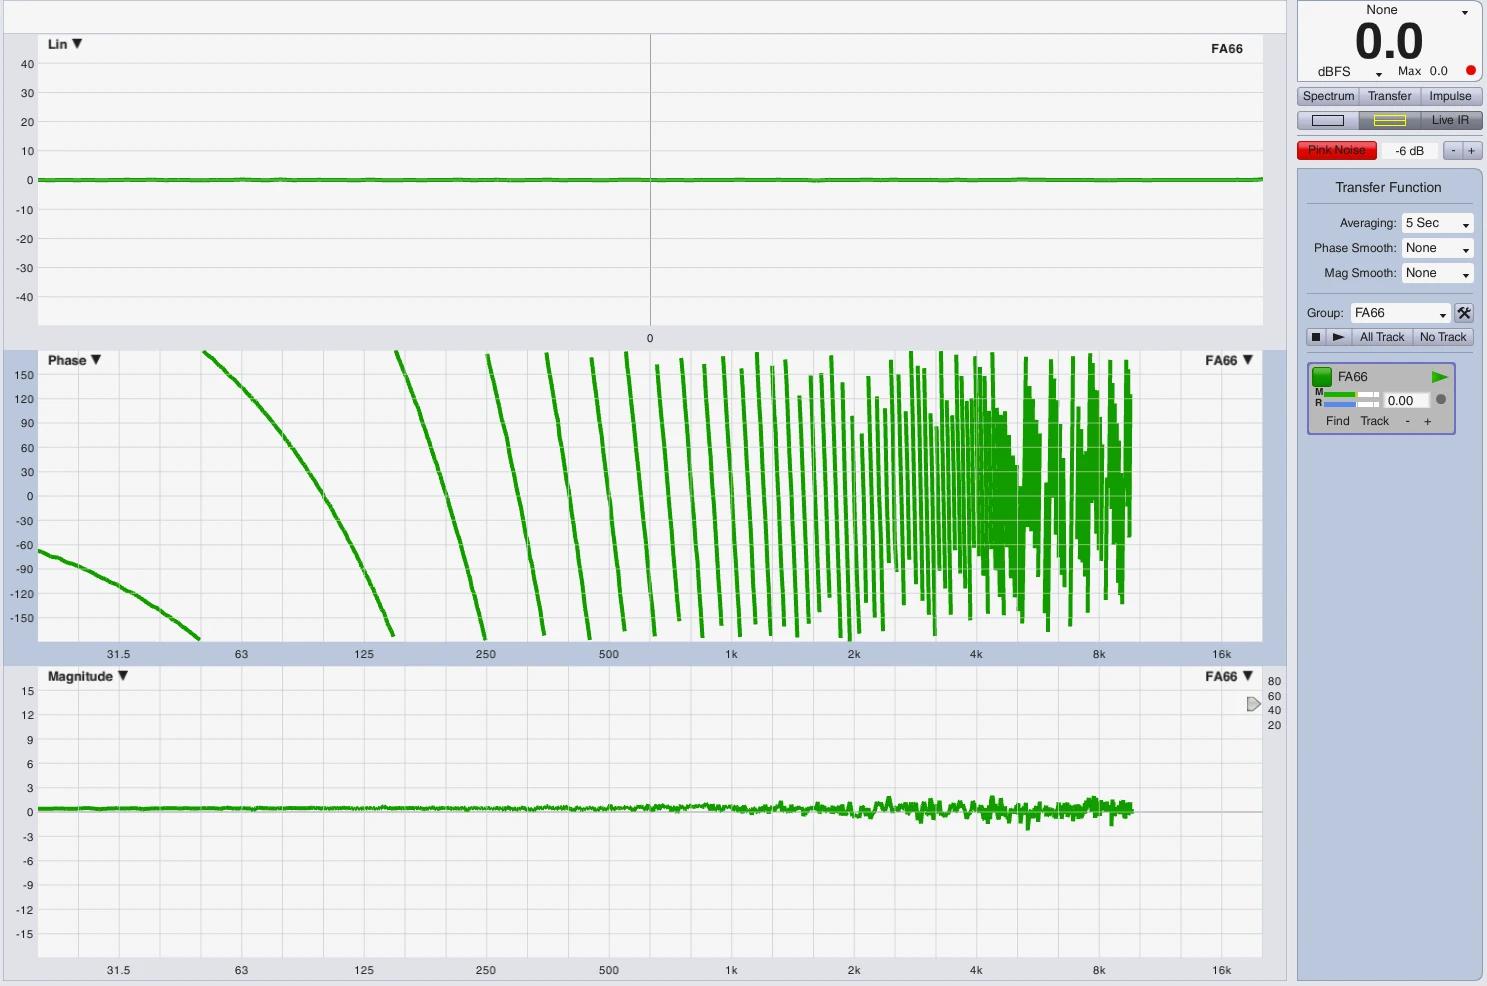
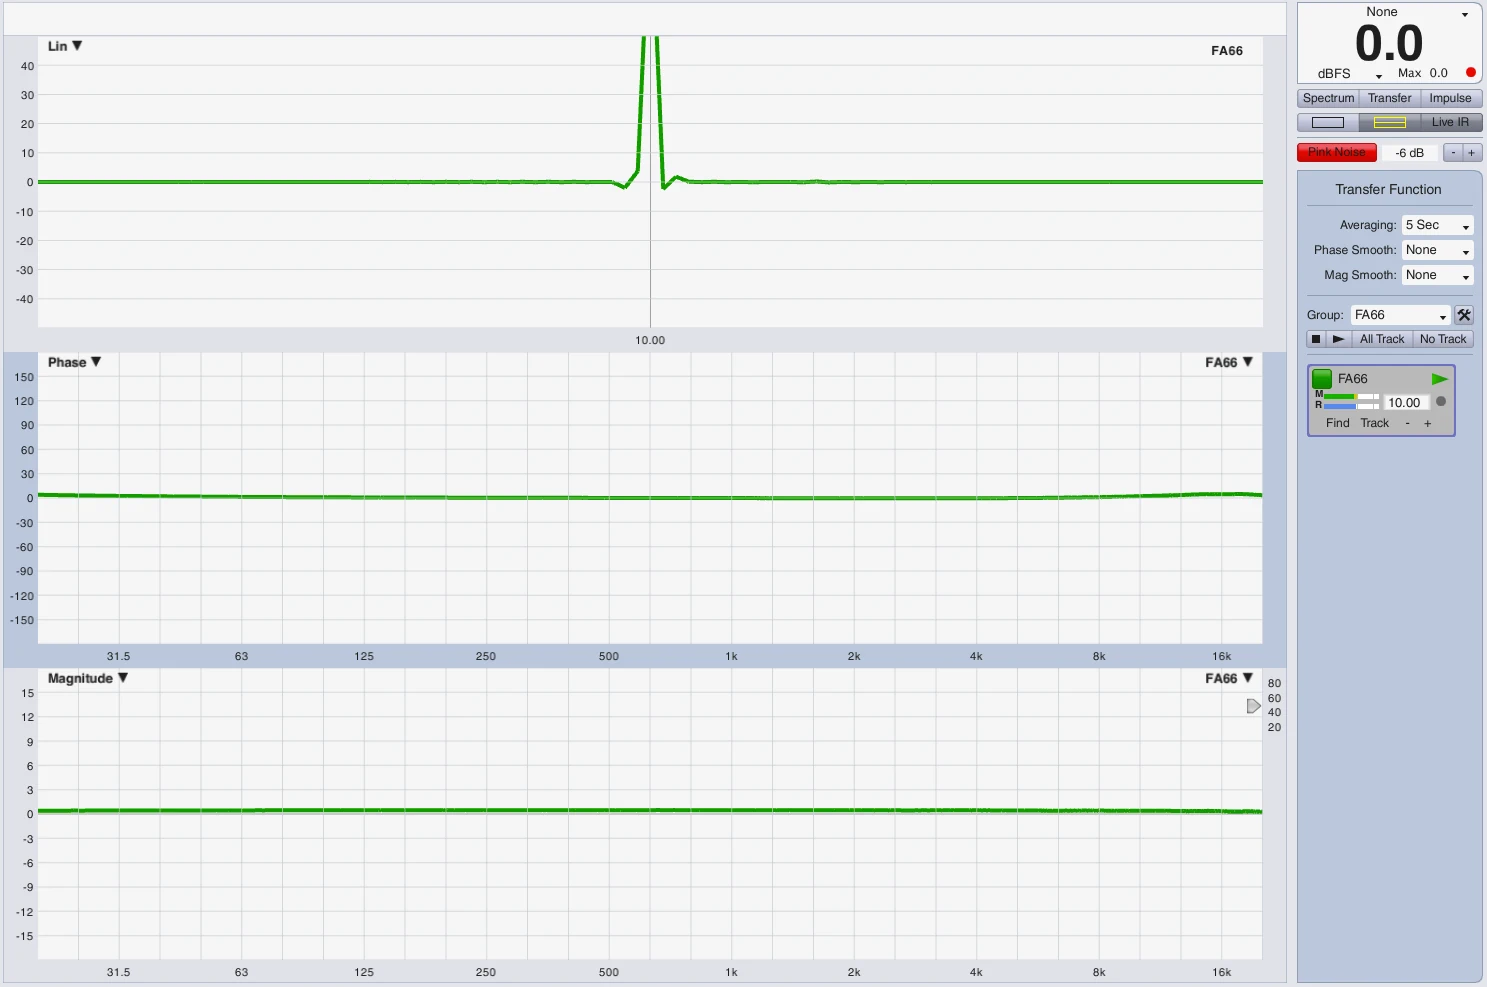
The example of complex vibration used above is located at the entrance of our sound system and we compare it with the system output, e.g. loudspeaker links to measuring microphone. For this model we assume purely hypothetically that the system has no distortion and only causes a delay X with a constant group runtime. Part of this delay is due to the processing in the controlling electronics, another part of the runtime of the sound from the speaker to the measuring microphone, the signal itself is 100% identical. Suppose the total delay is 10ms and the part of the electronics is 3ms, the acoustic 7ms. Can we describe this delay or constant group runtime with the phase angle? The answer is NO. As with the above example, we can only take the delay time and convert it into a phase angle at a frequency X, e.g. the delay is 10ms, which corresponds to 360° or the period duration of 100Hz, but 10ms are also 180° at 50Hz or half a period duration, etc. The whole thing can be led ad absurdum for any frequency ... and that is exactly what the display of the phase frequency response of our two-channel measuring system does. Only when we virtually delay the reference channel by the exact measured delay time does the phase frequency response show us a clean grade line to 0° over the entire frequency spectrum, which corresponds to the constructed reality.
ATTENTION OFF TOPIC
Impulse representation on the timeline
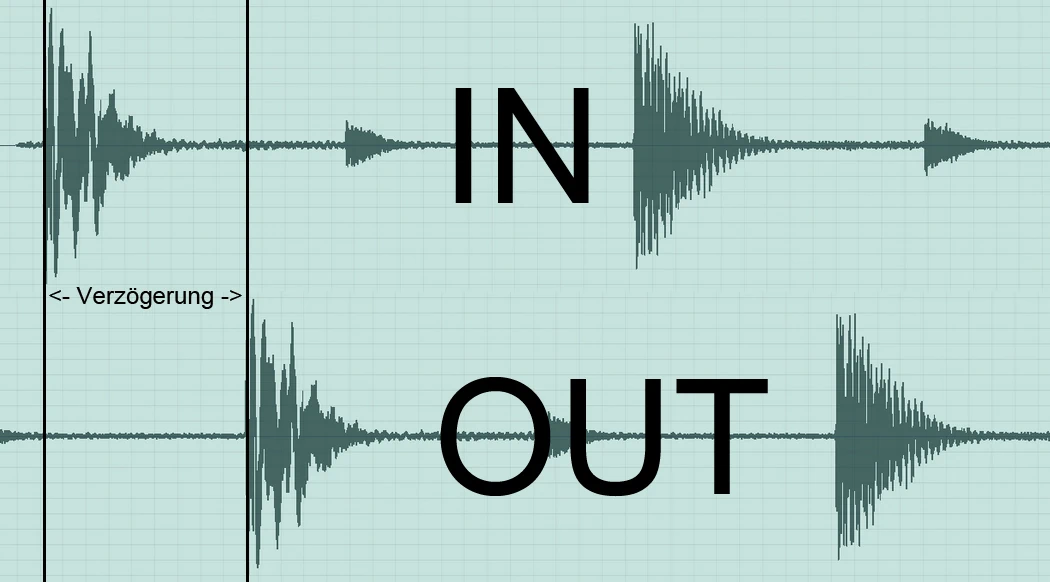
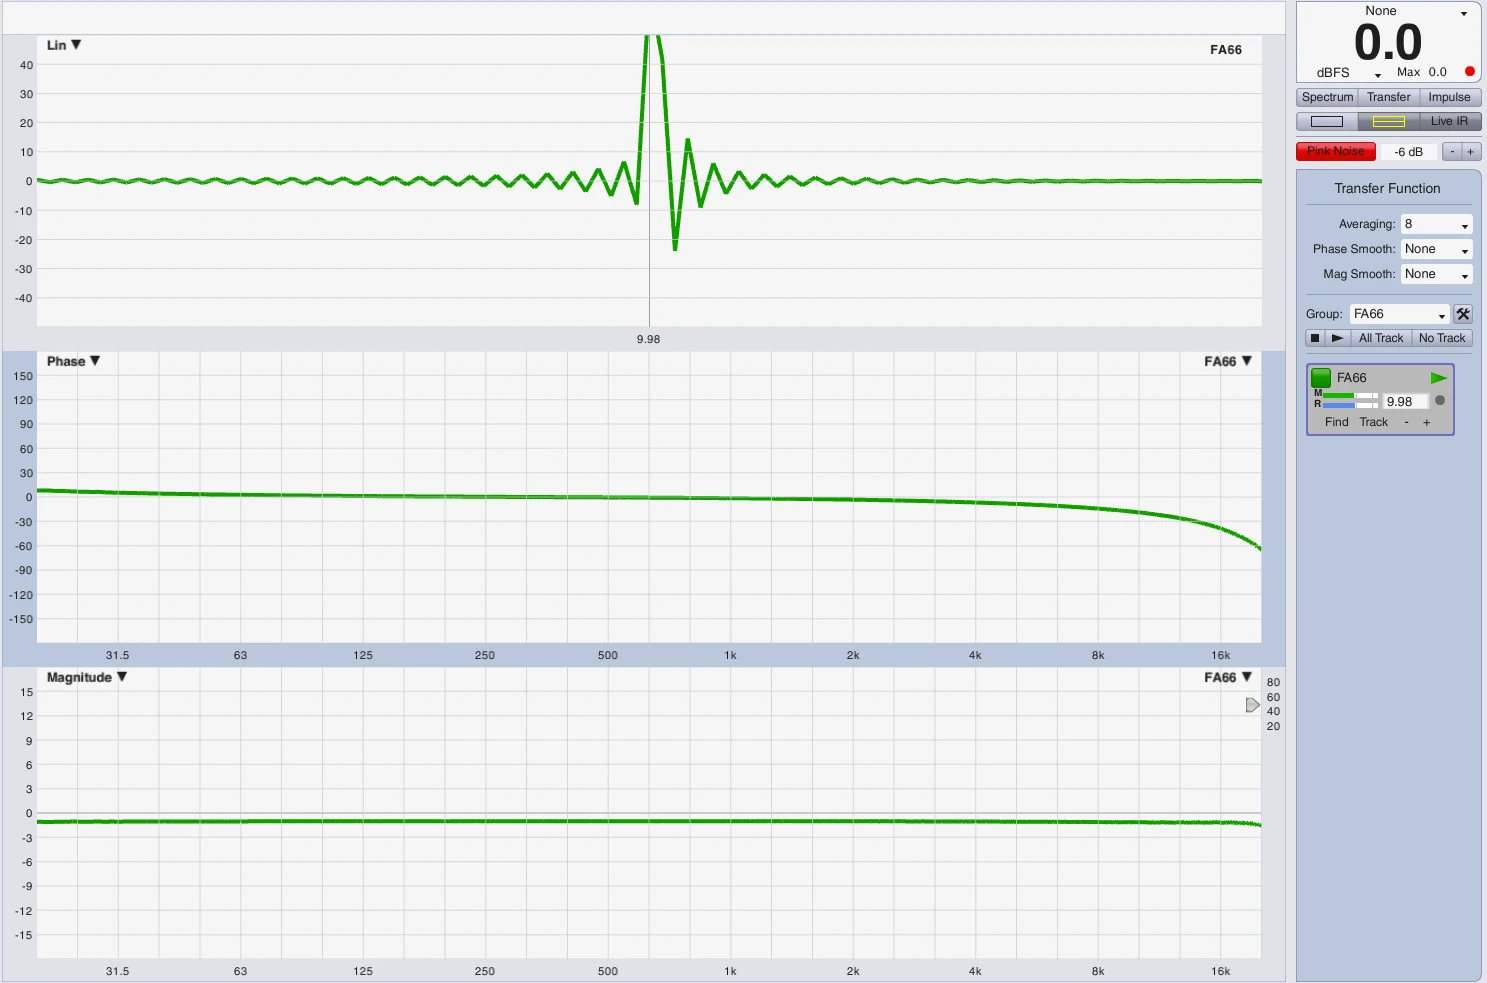
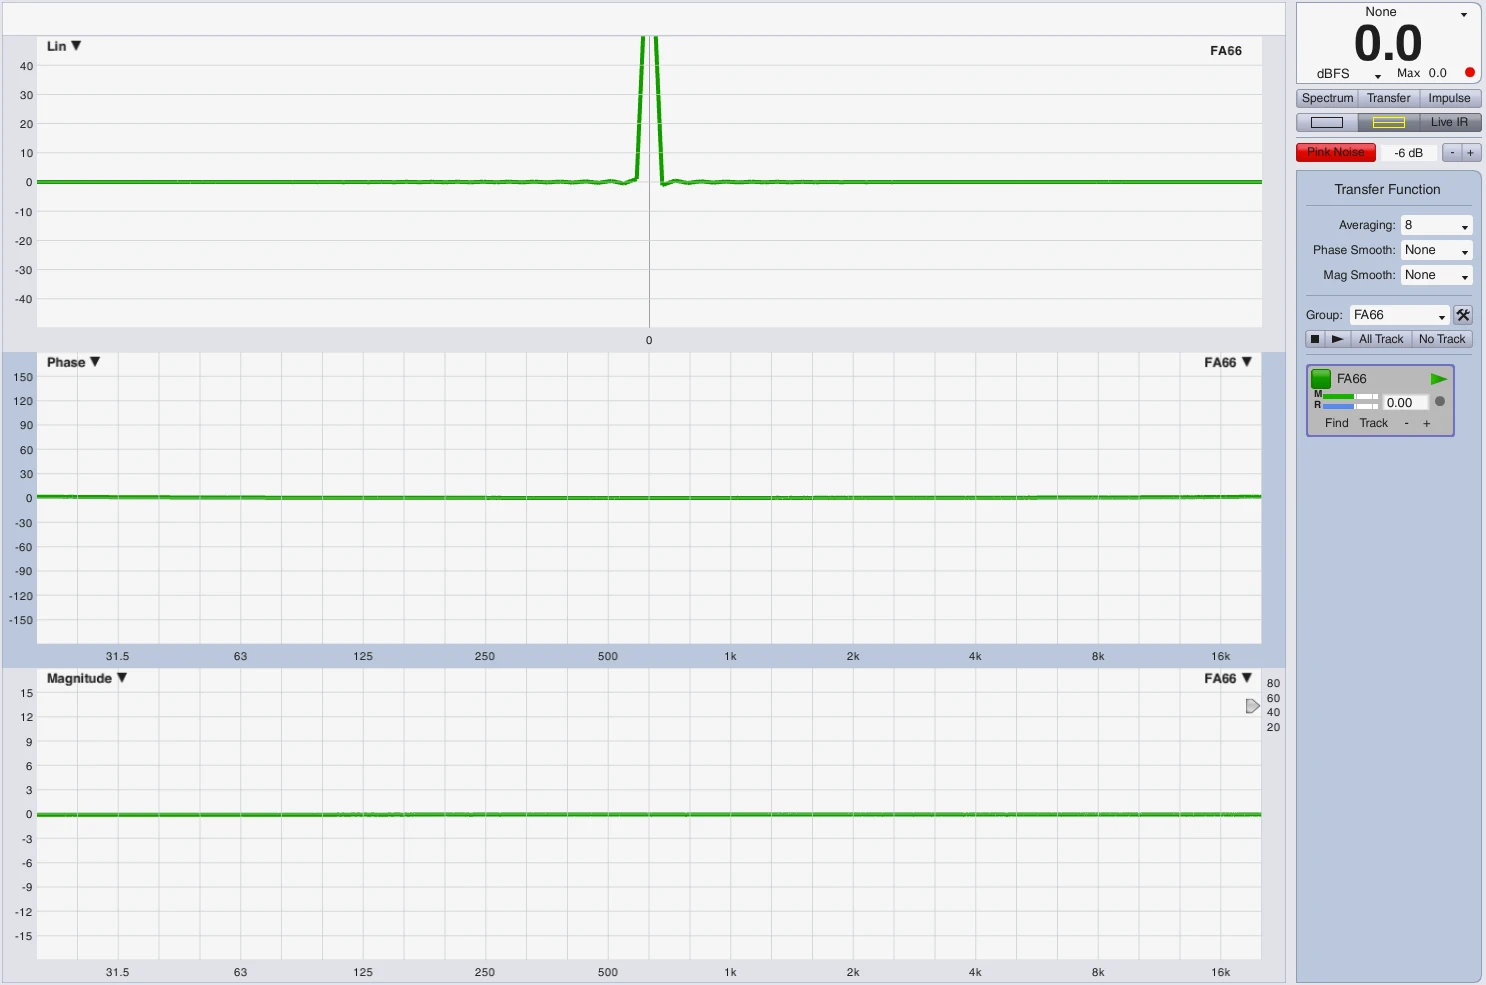
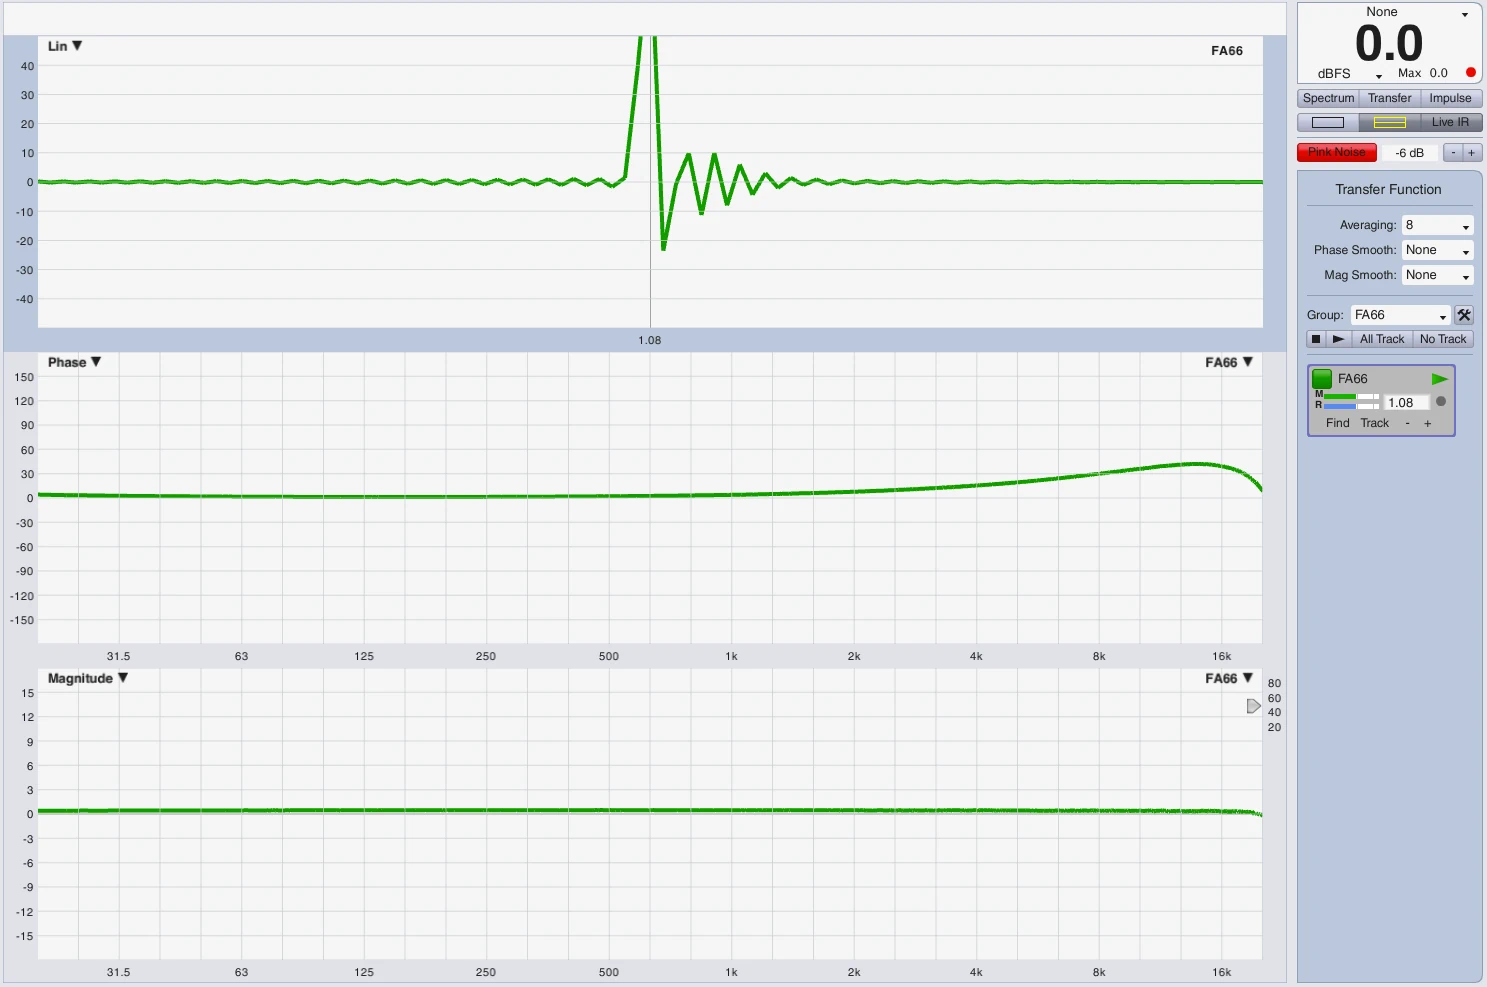
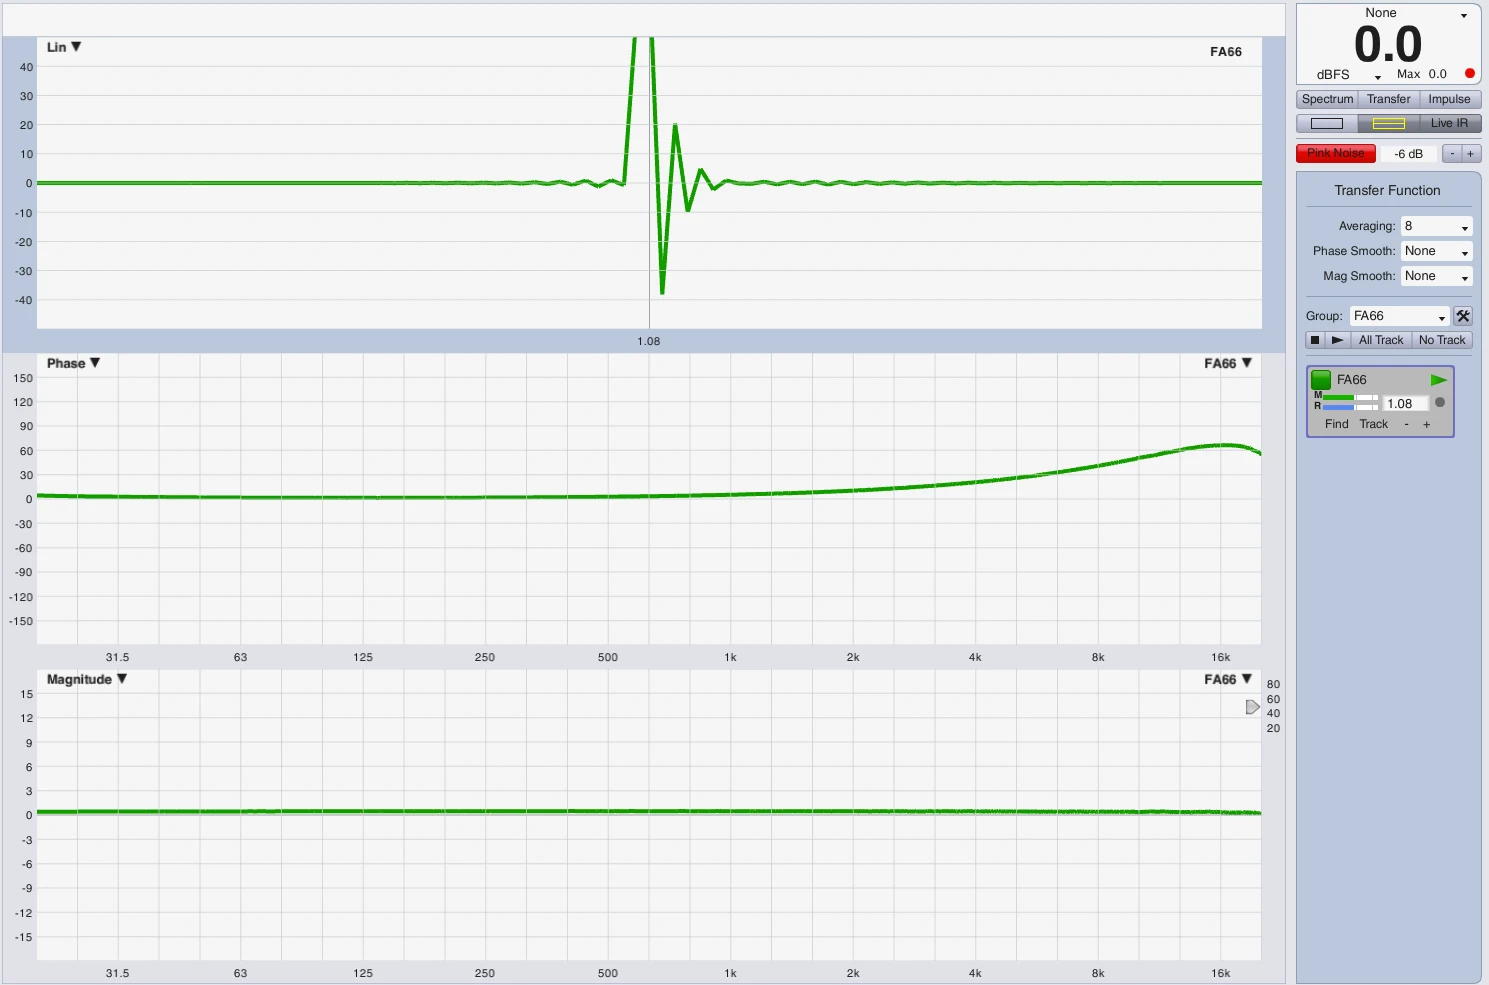
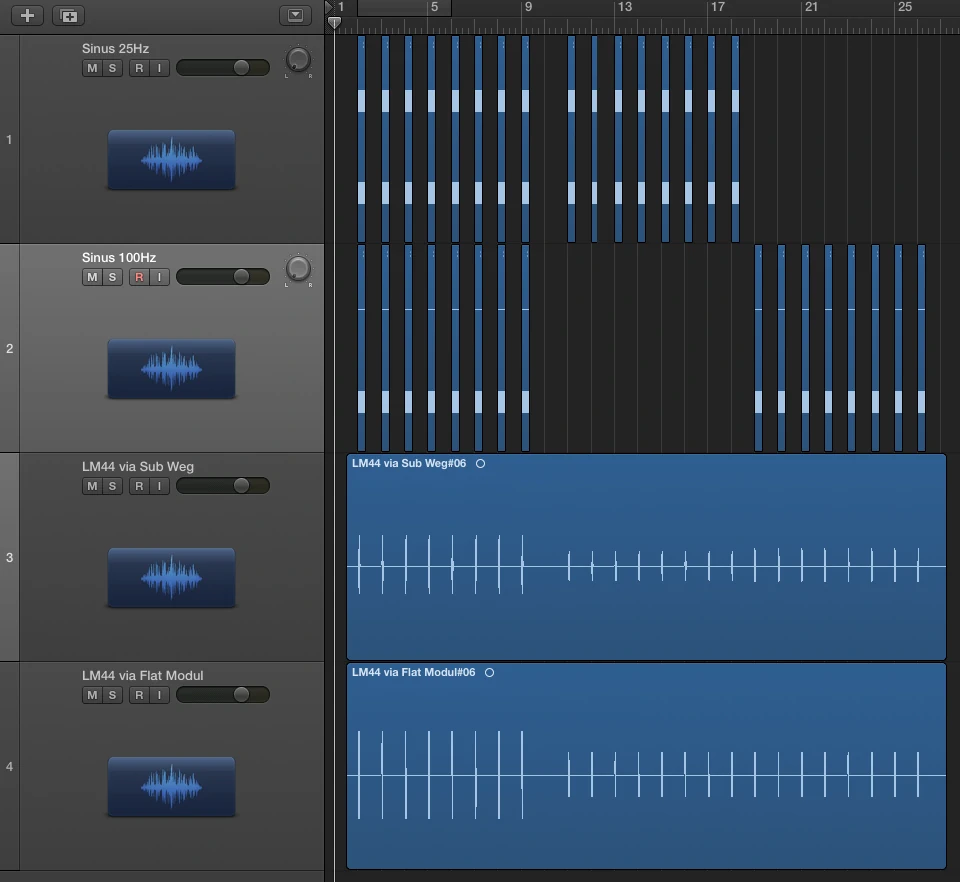
In order to represent the envelope or the signal deflection I have carried out the following experimental setup. In module A, an LM44 has the subpath shown above with HPF at 25Hz and LPF at 100Hz each 24dB Butterworth. Module B is flat. In Logic I created a 25Hz sine and a 100Hz sine. I have trimmed both regions to the length of a period at 25Hz. Both signals (25Hz+100Hz) leave Logic via output 1 via DVS (...all at 96kHz) in LM44 module A+B and also return via DVS in input 1 + 2. Input 1 = Module A with Sub Processing, Input 2 = Module B without filter. Since you have to consider that a mixture of 2 sine signals immediately generates an addition and a new complex signal and unfortunately I just lack the time to determine an optimal frequency ratio I have created 3 recordings, each via module A and module B. The frequency mixture, 25Hz solo, 100Hz solo.
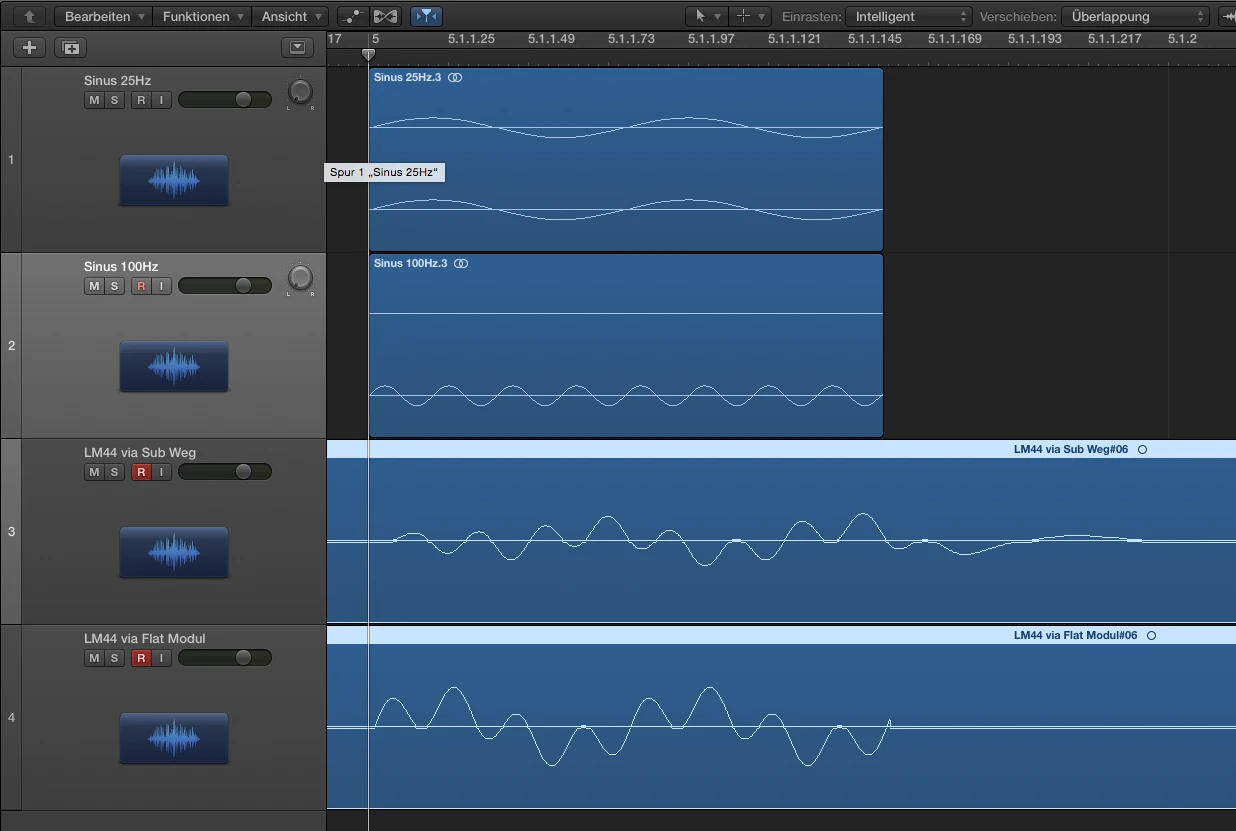
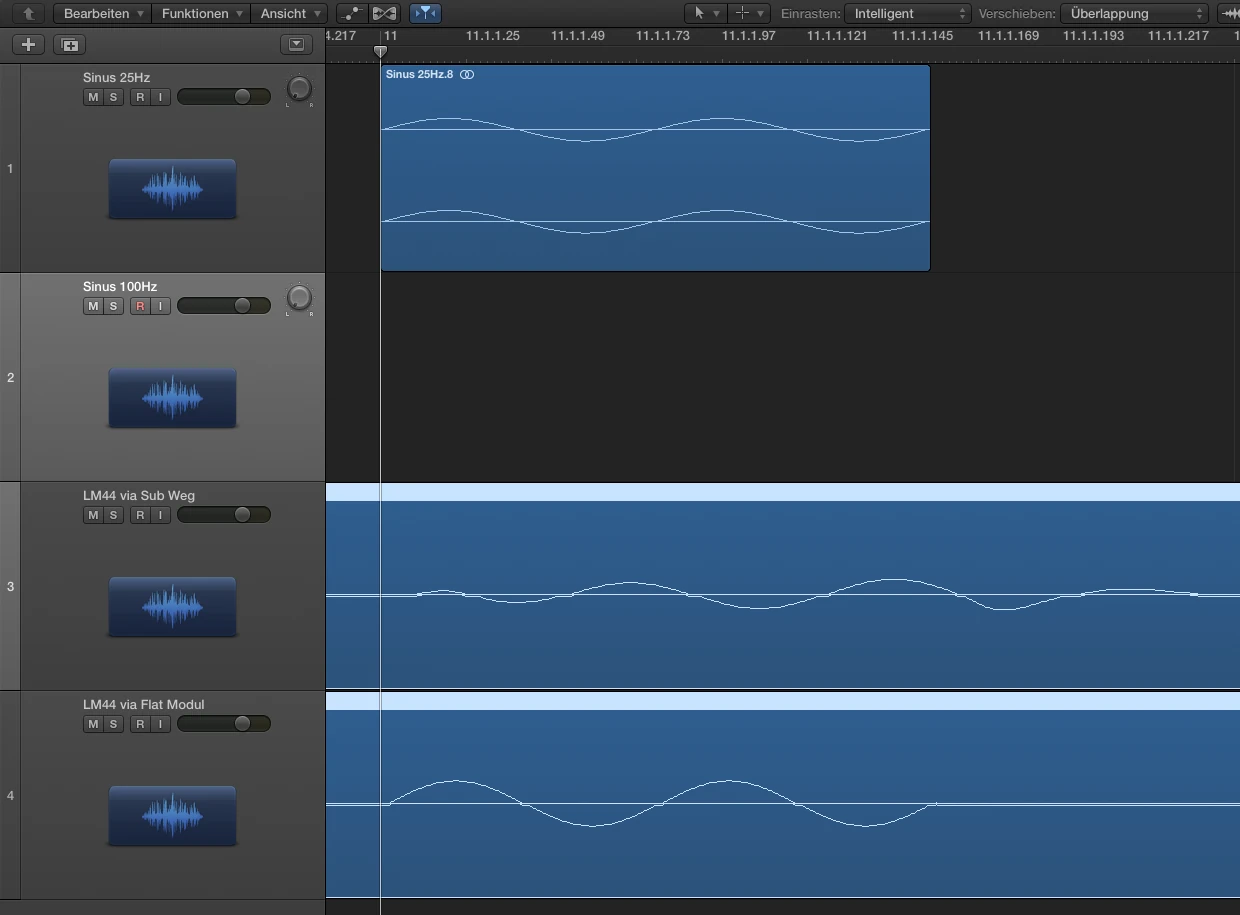
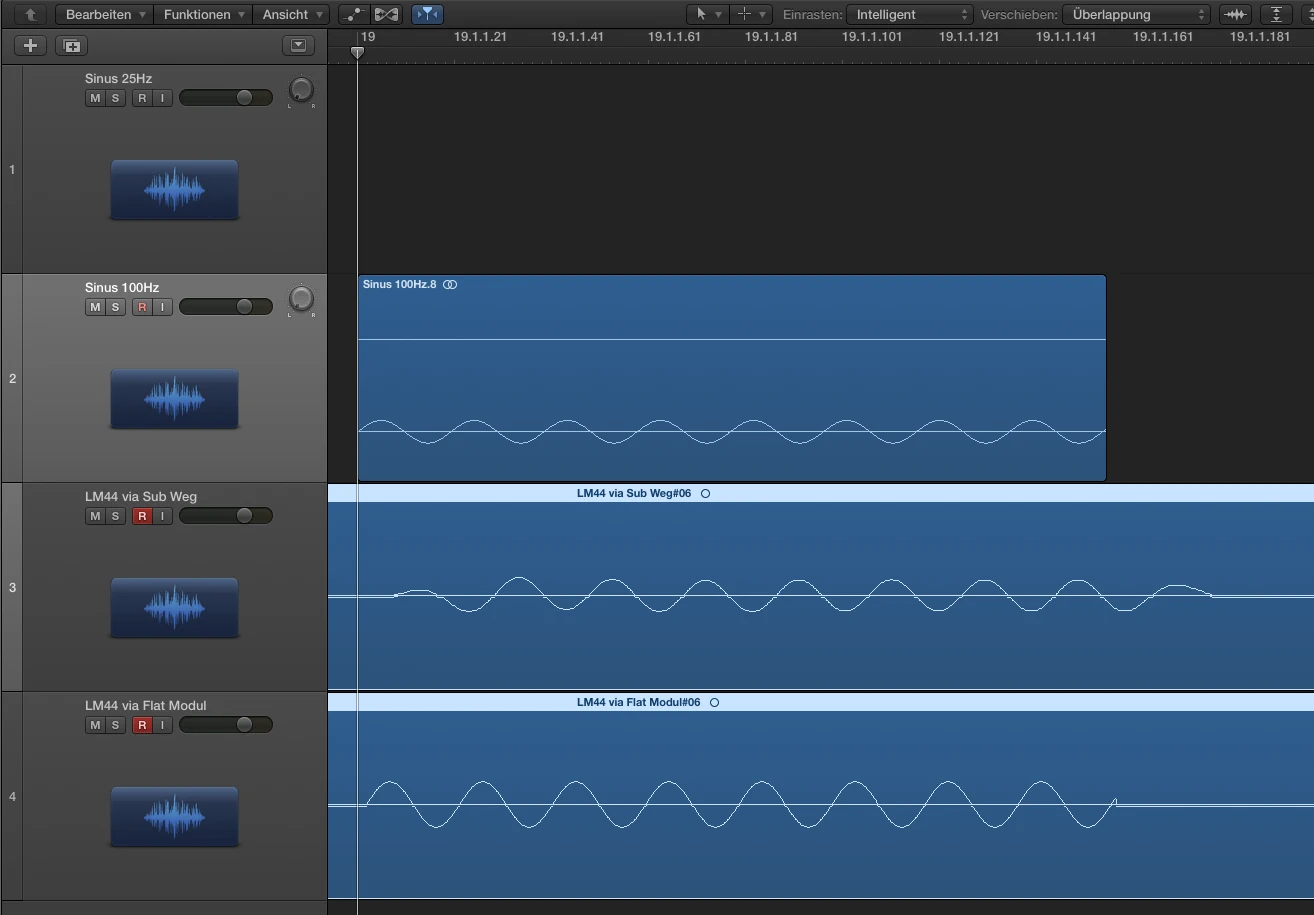
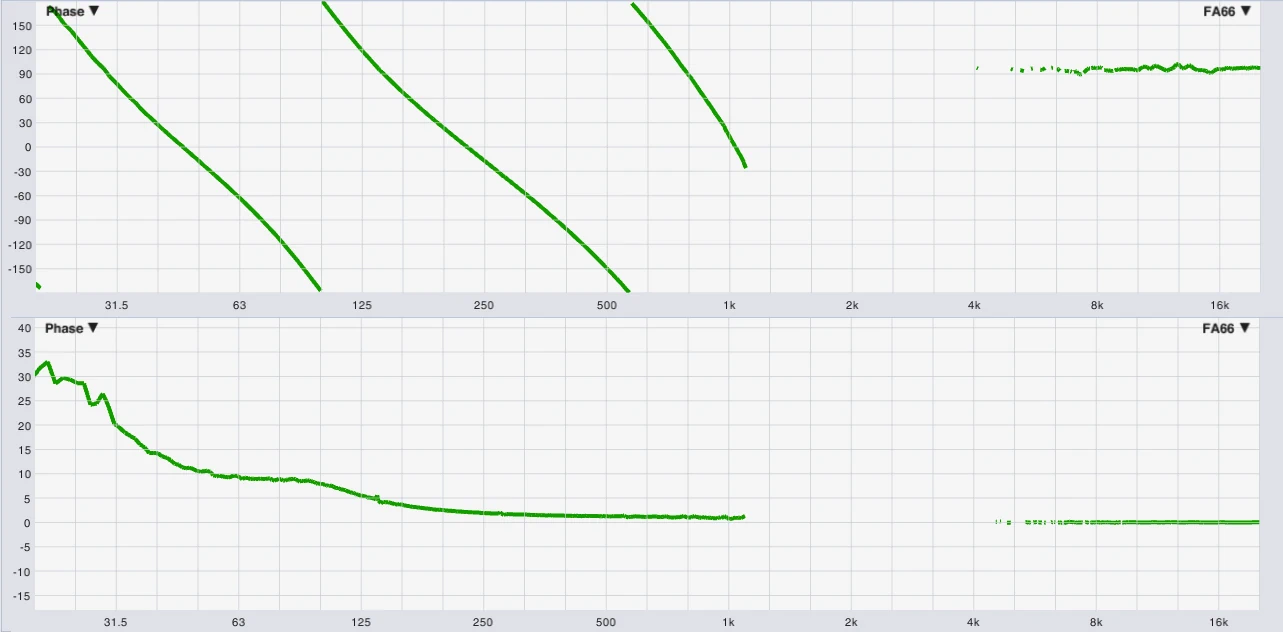
The group duration is higher than that of the source,
but smaller than that at 25Hz, see Smaart measurement.
FACT
1. The group runtime describes the frequency-dependent runtime behavior of a transmission system through which a band-limited signal passes completely.
(Band limited can of course also mean 20Hz to 20kHz, or 50Hz with bandwidth X where the system itself always has a bandwidth and the viewing can only be further limited by the continuous signal = sine. This can of course also happen in reverse by means of FFT measurement technology)
2. The group runtime can be constant and thus the same for all frequencies. It corresponds to a simple signal delay.
3. If the group runtime is not constant, this corresponds to a distortion of the phase Frequez gait. Individual frequencies of the transmission band have a longer runtime through the system than others. In this case, the envelope of the passing signal melts, the total duration of the observed frequency group begins and ends with the first or last change in amplitude. (i.e. the amplitude curve over time is drawn)
4. Although the term ‘frequency-dependent delay’ applies in some way, it is not sufficient, in my view, for the reasons mentioned above. If you look at a measurement you would say in the view of the phase frequency response with angular axis in degrees, the phase shift at X Hz is X degrees, which corresponds to Y ms at the considered frequency. If you switch the display to group runtime, we see directly the group runtime at X Hz in Y ms. Since the system usually has a non-constant group runtime, apart from FIR optimized top parts, it makes sense to use the word group runtime directly, e.g. the group runtime at X Hz is Y ms.
I hope I was able to bring a bit of clarity to the topic of phase and group duration with my contribution and I am happy about constructive discussions on the exciting topic. In a follow-up article, I could deal with the topic of all-pass filters as an alternative to delay when setting up public address systems. This increasingly popular method can definitely make sense if you use it to optimize the distortion of the phase frequency response of the sound system. However, it can also go backwards if you achieve exactly the opposite. My hypothesis is “Interesting, but not a panacea that should be preferred blindly”.
Links & Thanks
My thanks go to Anselm Goertz, who first picked up the topic in Production Partner 01/2017 and thus probably half of Germany came up against the head to question the usual way of thinking ... what he did at least with me. However, it was only after Michael Häck started a discussion with a heretical question that usually leads me to a sleepless weekend until I cracked the nut. Markus Zehner inspired me to tackle the topic phase from the beginning and think more deeply about the basics, Merlijn van Veen I thank for his meticulous work on examples that inspired me to lead my own derivatives. We can only agree on one point that Markus has aptly formulated ‘the longer I think about the problem, the less certain I am that I have understood it at all’. In this sense, critical questioning is welcome and suggestions for correction are welcome.